Custom Search
As you I just discussed in the Spectral Lines page, electrons fall to lower energy levels and give off light in the form of a spectrum.
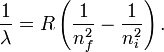
These spectral lines are actually specific amounts of energy for when an electron transitions to a lower energy level. If you assume the energy levels of an atom to be a staircase; if you roll a ball down the stairs the ball only has a few "steps" that it can stop on. This is the same situation an electron is in. Electrons can only occupy specific energy levels in an atom. It most be on an energy level if it is in the atom. There is no in between. This is why you get lines and not a "rainbow" of colors when electrons fall. Jahann Balmer in 1885 derived an equation to calculate the visible wavelengths that the hydrogen spectrum displayed. The lines that appear at 410 nm, 434 nm, 486 nm, and 656 nm. These electrons are falling to the 2nd energy level from higher ones. This transition to the 2nd energy level is now referred to as the "Balmer Series" of electron transitions. Johan Rydberg use Balmers work to derived an equation for all electron transitions in a hydrogen atom. Here is the equation:
R= Rydberg Constant 1.0974x10⁷ m-1; λ is the wavelength; n is equal to the energy level (initial and final) If we wanted to calculate energy we can adjust R by multipling by h (planks constant) and c (speed of light)
Now we have Rydbergs equation to calculate energy. RE= -2.178 x 10⁻¹⁸J (it is negative because energy is being emitted)
l = h c / E l = ( 6.626 x 10 - 34 J s) (3.0 x 10⁸ m/s)/E 1nm= 1 x 10⁻⁹m
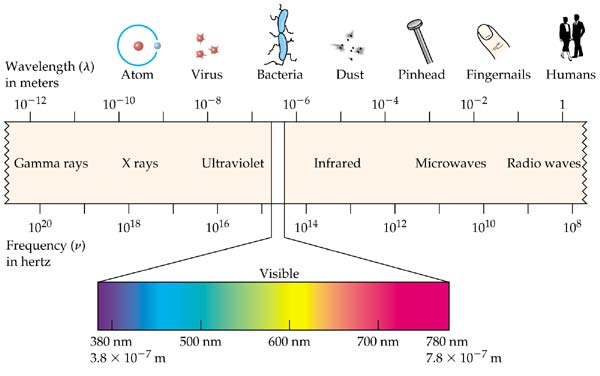
Converting Wavelength to frequency
| ||||||||||||||||||||||||||||||||||||||||||||||||||||||||||||||||||||||||||||||||||||||||||||||||||||