What happens to the temperature of a block of ice when you put a Bunsen burner underneath it? You might think that the temperature goes up smoothly, but that's not what happens. The graph of temperature against time is called a heating curve. Let's look at the heating curve for water.
Notice that, in general, the temperature goes up the longer the heating continues. However, there are two horizontal flat parts to the graph. These happen when there is a change of state. The plateaus are also called phase changes.
The first change of state is melting (changing from a solid to a liquid). The temperature stays the same while a substance melts. For water, this temperature is 0°C because the melting point for water is 0°C.
The second change of state is boiling (changing from a liquid to a gas). The temperature stays the same while a substance boils. For water, this temperature is 100°C because the boiling point for water is 100°C.
Different substances have different melting points and boiling points, but the shapes of their heating curves are very similar. For example, this is the heating curve for iron, a metal that melts at 1538°C and boils at 2861°C.
Cooling Curves
Heating curves show how the temperature changes as a substance is heated up. Cooling curves are the opposite. They show how the temperature changes as a substance is cooled down. Just like heating curves, cooling curves have horizontal flat parts where the state changes from gas to liquid, or from liquid to solid.
You are likely to have used salol or stearic acid in a school practical lesson to make your own cooling curve. Salol has a melting point of about 45°C and stearic acid has a melting point of about 69°C. They are easily melted in a boiling tube placed in a beaker of hot water. The temperature can be followed using a thermometer or temperature probe connected to a data logger. The liquid may be cooled by putting the boiling tube in a beaker of cold water or just leaving it in the air.
***Note- The melting and freezing occur at the same temperature.
During freezing, energy is removed and during melting, energy is absorbed.
1 The solid and liquid phases of water can exist in a state of equilibrium at 1 atmosphere of pressure and a temperature of
(1) 0oC (2) 100oC (3) 273oC (4) 373oC
ANSWER--->
The melting point of water is OoC or 273K
2 Given the equation: H2O(s) <--> H2O(l) At which temperature will equilibrium exits when the atmospheric pressure is 1 atm?
(1) 0 K (2) 100 K (3) 273 K (4) 373 K
ANSWER--->
The melting point of water is OoC or 273K
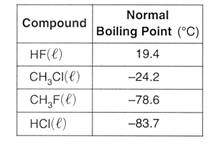
3 The table below shows the normal boiling point of four compounds.
Which compound has the strongest intermolecular forces? (1) HF(l) (2) CH3Cl(l) (3) CH3F(l) (4) HCl(l)
ANSWER--->
HF The higher the boiling Point the stronger the force of attraction between the molecules
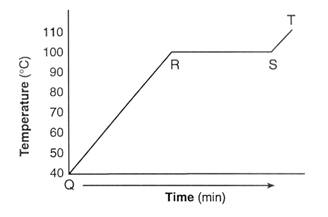
A sample of water is heated from a liquid at 40oC to a gas at 110oC.
a)On the heating curve diagram provided above, label each of the following regions:
Liquid, only ; Gas, only; Phase change
b) For section QR of the graph, state what is happening to the water molecules as heat is added.
c) For section RS of the graph, state what is happening to the water molecules as heat is added.
ANSWER a--->
QR-liquid only RS-Phase Change ST Gas only
ANSWER b--->
QR-Kinetic Energy increases
ANSWER c--->
RS- Potential Energy Increases
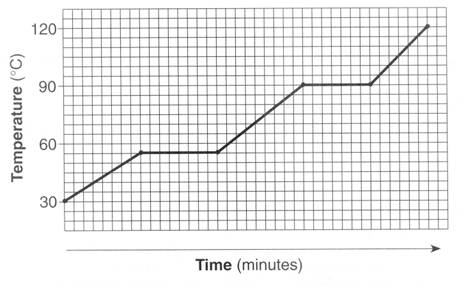
3 The graph below represents the heating curve of a substance that starts as a solid below its freezing point.
What is the melting point of this substance? (1) 30oC (2) 55oC (3) 90oC (4) 120oC
ANSWER--->
55 degrees the lower plateu is the melting/freezing point
8/03
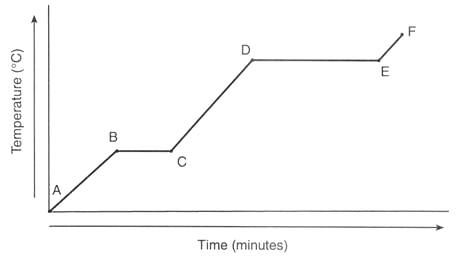
Base your answers to questions 59 through 62 on the information below. Given the heating curve where substance X starts as a solid below its melting point and is heated uniformly:
59 Identify the process that takes place during line segment DE of the heating curve.
ANSWER--->
Vaporization, boiling or phase change. NOT evaporation (that occurs below the boiling point).
60 Identify a line segment in which the average kinetic energy is increasing.
ANSWER--->
AVG. KE is temp, AB CD or EF
61 Using "o" to represent particles of substance X, draw at least five particles as they would appear in the substance at point F.
ANSWER--->
The five particles would be spread out.
62 Describe, in terms of particle behavior or energy, what is happening to substance X during line segment BC.
ANSWER--->
The particles are increasing in potential energy.
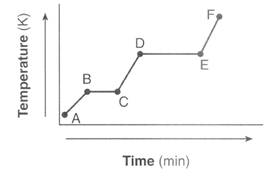
Base your answers to questions 54 and 55 on the heating curve below, which represents a substance starting as a solid below its melting point and being heated at a constant rate over a period of time.
54 What is happening to the average kinetic energy of the particles during segment BC?
ANSWER--->
Since Avg. KE is Temperature, it remains the same.
55 How does this heating curve illustrate that the heat of vaporization is greater than the heat of fusion?
ANSWER--->
Segment DE is Longer than BC. More energy requires more time. NOT DE is at a higher temp.
6/05
17 In which process does a solid change directly into a vapor?