 Custom Search Back to Acid Base Links
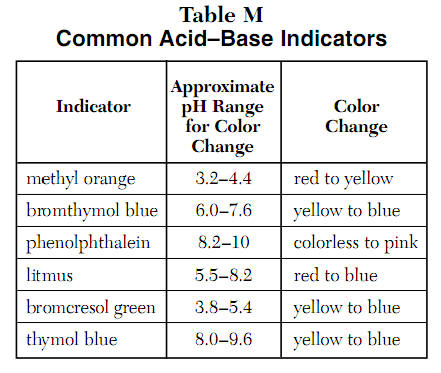
Acid Base indicators change color depending on the pH of the solution. Below is a table that includes the pH range of the change and the colors involved for many different indicators.
Tricks to using NYS Chemistry Reference Table M
Tip 1- Notice "Common Acid Base Indicators", acid is on the left and base is on the right. Low pH numbers are on the left and high pH numbers are on the right. They match up. Tip 2- Look at methyl Orange, red is on the left, 3.2 is on the left. To the left (or below) a pH of 3.2 the color is red. To the right (above) a pH of 4.4 the color is yellow. Tip 3- Between the 2 numbers will never be asked on a test. This is where the indicator changes color. Past Regents questions involving Acid Base Indicators Aug 2010-27 Based on the results of testing colorless solutions with indicators, which solution is most acidic? June 2009-48 Which indicator would best distinguish between a solution with a pH of 3.5 and a solution with a pH of 5.5? Aug 2008-25 Which indicator is blue in a solution that has a pH of 5.6? Jan 2008-47 Which indicator, when added to a solution, changes color from yellow to blue as the pH of the solution is changed from 5.5 to 8.0? Jan 2006-47 Which indicator is yellow in a solution with a pH of 9.8? June 2005-50 In which solution will thymol blue indicator appear blue? Jan 2005-26 According to Reference Table M, what is the color of the indicator methyl orange in a solution that has a pH of 2? Advanced Chemistry Topics Litmus
The un-ionized litmus is red, whereas the ion is blue. Adding hydroxide ions:
Adding hydrogen ions:
Methyl orange
Phenolphthalein
he pH range of indicators The importance of pKind Think about a general indicator, HInd - where "Ind" is all the rest of the indicator apart from the hydrogen ion which is given away:
Because this is just like any other weak acid, you can write an expression for Ka for it. We will call it Kind to stress that we are talking about the indicator.
Think of what happens half-way through the colour change. At this point the concentrations of the acid and its ion are equal. In that case, they will cancel out of the Kind expression.
You can use this to work out what the pH is at this half-way point. If you re-arrange the last equation so that the hydrogen ion concentration is on the left-hand side, and then convert to pH and pKind, you get:
That means that the end point for the indicator depends entirely on what its pKind value is. For the indicators we've looked at above, these are:
The pH range of indicators Indicators don't change color sharply at one particular pH (given by their pKind). Instead, they change over a narrow range of pH. Assume the equilibrium is firmly to one side, but now you add something to start to shift it. As the equilibrium shifts, you will start to get more and more of the second colour formed, and at some point the eye will start to detect it. For example, suppose you had methyl orange in an alkaline solution so that the dominant colour was yellow. Now start to add acid so that the equilibrium begins to shift. At some point there will be enough of the red form of the methyl orange present that the solution will begin to take on an orange tint. As you go on adding more acid, the red will eventually become so dominant that you can no longe see any yellow. There is a gradual smooth change from one colour to the other, taking place over a range of pH. As a rough "rule of thumb", the visible change takes place about 1 pH unit either side of the pKind value. The exact values for the three indicators we've looked at are:
The litmus colour change happens over an unusually wide range, but it is useful for detecting acids and alkalis in the lab because it changes colour around pH 7. Methyl orange or phenolphthalein would be less useful. This is more easily seen diagramatically.
For example, methyl orange would be yellow in any solution with a pH greater than 4.4. It couldn't distinguish between a weak acid with a pH of 5 or a strong alkali with a pH of 14. Choosing indicators for titrations Remember that the equivalence point of a titration is where you have mixed the two substances in exactly equation proportions. You obviously need to choose an indicator which changes colour as close as possible to that equivalence point. That varies from titration to titration. Strong acid v strong base The next diagram shows the pH curve for adding a strong acid to a strong base. Superimposed on it are the pH ranges for methyl orange and phenolphthalein.
You can see that neither indicator changes colour at the equivalence point. However, the graph is so steep at that point that there will be virtually no difference in the volume of acid added whichever indicator you choose. However, it would make sense to titrate to the best possible color with each indicator. If you use phenolphthalein, you would titrate until it just becomes colourless (at pH 8.3) because that is as close as you can get to the equivalence point. On the other hand, using methyl orange, you would titrate until there is the very first trace of orange in the solution. If the solution becomes red, you are getting further from the equivalence point. Strong acid vs. Weak base
This time it is obvious that phenolphthalein would be completely useless. However, methyl orange starts to change from yellow towards orange very close to the equivalence point. You have to choose an indicator which changes colour on the steep bit of the curve. Weak acid vs Strong base
This time, the methyl orange is hopeless! However, the phenolphthalein changes colour exactly where you want it to.
Weak acid vs Weak base The curve is for a case where the acid and base are both equally weak - for example, ethanoic acid and ammonia solution. In other cases, the equivalence point will be at some other pH.
You can see that neither indicator is any use. Phenolphthalein will have finished changing well before the equivalence point, and methyl orange falls off the graph altogether. It may be possible to find an indicator which starts to change or finishes changing at the equivalence point, but because the pH of the equivalence point will be different from case to case, you can't generalise. On the whole, you would never titrate a weak acid and a weak base in the presence of an indicator. Sodium carbonate solution and dilute hydrochloric acid This is an interesting special case. If you use phenolphthalein or methyl orange, both will give a valid titration result - but the value with phenolphthalein will be exactly half the methyl orange one.
It so happens that the phenolphthalein has finished its colour change at exactly the pH of the equivalence point of the first half of the reaction in which sodium hydrogencarbonate is produced.
The methyl orange changes colour at exactly the pH of the equivalence point of the second stage of the reaction.
Back to Acid Base Links |